Marine
It will take time for marine condition to show improvements as there are significant time lags between implementation of land management practices and measurable outcomes in these systems.
Inshore marine condition is also strongly influenced by severe weather events, such as tropical cyclones and floods, which have impacted all regions in recent years.
This section focuses mainly on the inshore area of the Great Barrier Reef. Water quality at mid and outer shelf sites is generally good to very good overall because it is less directly influenced by river discharge.
Marine trend since 2014–15:
 Improvement in score
 Decline in score
 No change in score
- No arrow = change in methodology, trend not applicable.
Indicator confidence is based on expert opinion and direct measures of error.
Confidence in the marine results in Cape York and Burnett Mary remains low due to limited data availability and validation. Inshore coral is not assessed through the Marine Monitoring Program in these regions. Consequently, data from these regions is not used in the Great Barrier Reef-wide coral assessment.
Further details on the scoring system and qualitative confidence rankings for each indicator are outlines in the supporting technical information.
Inshore Great Barrier Reef
Overall the reef’s inshore marine environment was in moderate condition during 2015–2016. Inshore water quality was moderate overall. Regional water quality was assessed as good in Cape York, Wet Tropics, Burdekin and Burnett Mary regions, partly due to an absence of Tropical Cyclones and below average rainfall and freshwater discharge during 2015–2016. Inshore seagrass meadows showed slight improvements in condition for some indicators, but remained poor overall. Inshore coral reefs south of the Daintree (Wet Tropics) were in moderate condition in 2015–2016. The 2016 bleaching event severely impacted the far northern and northern regions of the Great Barrier Reef from the tip of Cape York to Port Douglas. The full extent of 2017 bleaching impacts is being quantified and will be detailed in future report cards.
Summary of 2017 marine impacts
Since 2014 reefs around the world—including the Great Barrier Reef—have been affected by an ongoing global coral bleaching event of unprecedented magnitude. Since December 2015, sea surface temperatures on the Great Barrier Reef were above average due to the combined effects of climate change and a strong El Niño.
These conditions triggered mass coral bleaching in late summer 2016 and led to an estimated 29 per cent loss of shallow water coral Reef-wide, according to findings by the Great Barrier Reef Marine Park Authority. Mass coral bleaching occurred for the second consecutive year in summer 2016–2017 as sea surface temperatures remained above average.
In addition to the severe bleaching affecting over half the Great Barrier Reef since 2016, large portions of the Reef were also subjected to other simultaneous impacts during the 2016–2017 summer such as severe tropical cyclone Debbie, which will be reported in the next report card.
Great Barrier Reef

Cape York

Inshore coral is not assessed through the Marine Monitoring Program in Cape York (grey shading).
Information on the 2016 coral bleaching impacts in Cape York is available on the Great Barrier Reef Marine Park Authority website.
Wet Tropics

Burdekin

Mackay Whitsunday

Fitzroy

Burnett Mary

Inshore coral is not assessed through the Marine Monitoring Program in the Burnett Mary region (grey shading).
Read the detailed Marine results and methods .
Marine context
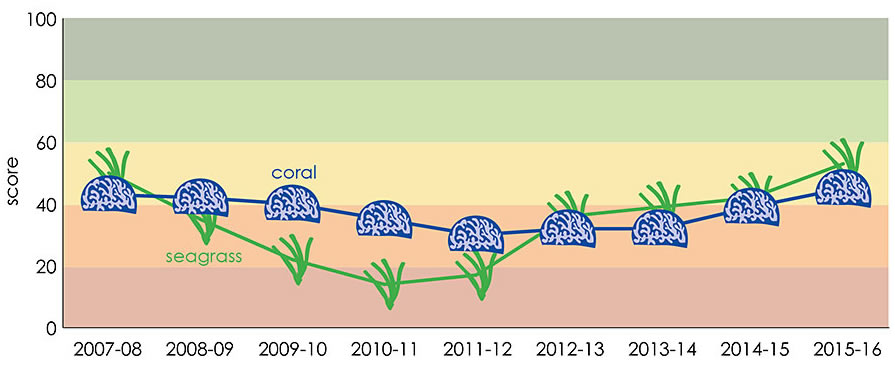
During 2015–2016 there were no cyclones that affected the Great Barrier Reef. This lack of cyclonic activity allowed coral and seagrass communities time to recover from the effects of multiple severe weather events that occurred in previous years (especially 2007–2012). Recovery is still in the early stages and the legacy of impacts from severe tropical cyclones on the Great Barrier Reef may last for decades, and it may take many years for diverse seagrass and coral communities to re-establish.
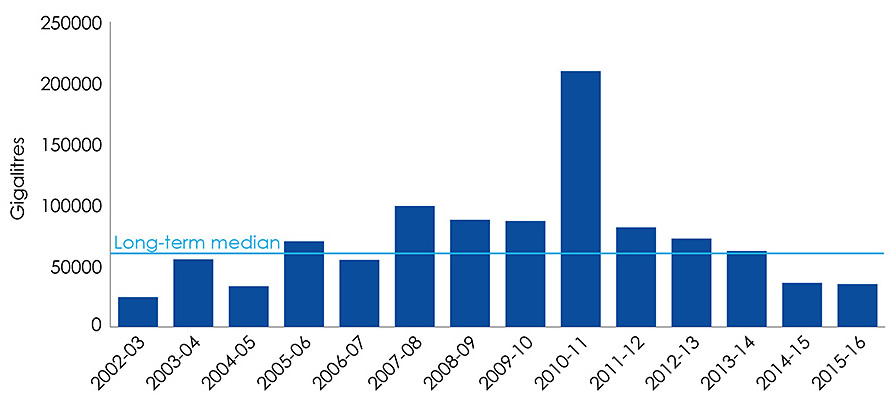
Rainfall and freshwater discharge was below the long-term median for the Great Barrier Reef catchment, similar to 2014–2015, see below.
 Open larger image
Monitored river flows for 2015–16 compared to the long-term median for the Great Barrier Reef catchment (from 2002–2016). Data file (CSV, 606.0Bytes) .
 Open larger image
Trend in coral cover change and seagrass abundance (Wet Tropic – Fitzroy). Data file (CSV, 586.0Bytes) .
- Last reviewed
- 23 June 2023
- Last updated
- 27 October 2017