Single spaced contour banks decrease soil yield in the Fitzroy region
About this case study
The objective of this case study was to compare runoff and sediment yield between single and triple spaced contour banks. The study utilised nine years (2000–2008) of data from a zero-tillage (weed control using herbicides), controlled traffic farming system farmed down-the-slope on black cracking clay soil (Vertosols).
Contour banks are designed to reduce erosion from the area between the banks. A single spaced contour bank is designed to withstand a 1 in 10 year runoff event. When contour banks fail they can concentrate runoff, leading to the formation of gullies. Contour bank failures can be more common with wider spaced banks. From an economic point of view, wider spaced banks are preferred by farmers where machinery operates down the slope and over the banks as they generate less damage to farming machinery, and require fewer contour banks to be constructed and maintained.
 Open larger image
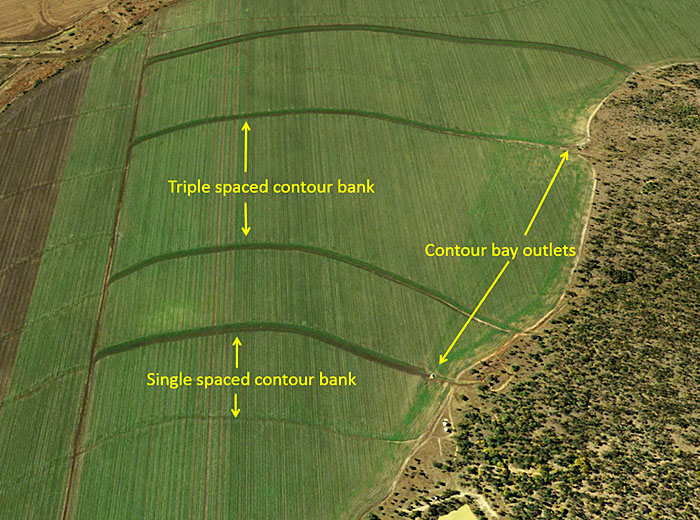
Figure 1: Cropping paddock study site layout showing single spaced and triple spaced contour banks with down-the-slope controlled traffic farming.
Key findings
- Single spaced contour banks (narrower spaced bays) generated 31 per cent less sediment compared to triple spaced contour banks (wider spaced bays) over a nine year period.
- A combination of low ground cover and long slopes can lead to bank failure and high sediment losses.
Implications for management
Wider spaced contour bays are more economical for farmers as they require less contour banks (lower maintenance and construction costs). However, results from this trial highlight that soil erosion risks increase when wide spaced contour banks (triple spaced) are combined with low ground cover. Maintaining a good level of ground cover (more than 30 per cent) helps to reduce soil erosion.
Methods
The study site was located approximately 10 kilometres south of Capella, in the upper Gordonstone Creek catchment, Central Queensland. The site is a dryland cropping paddock which has continuously farmed commercial grain for over 60 years and is characterised by coarse self-mulching, Vertosol soil overlying basalt.
Soil yield in runoff was measured at the outlet of two contour bays. The distance of contour bank spacing is dependent on slope. The spacing of the contour banks in this study was 180 metres for a single spaced contour bank and 450 metres for a triple spaced contour bank (Table 1).
| Contour bay site | Contour bay | ||
|---|---|---|---|
| Spacing (m) | Slope (%) | Area (ha) | |
| Single Spaced | 180 | 0.78 | 10 |
| Triple Spaced | 450 | 0.95 | 10 |
Results
The cropping paddock recorded an average annual rainfall of 504 millimetres from 2000 to 2008, which is below the long-term average 595 millimetres. During this period, the average annual soil yield was 1.2 t/ha (2.6 g/L Event Mean Concentration) from the single spaced contour bay and 1.7 t/ha (3.9 g/L EMC) from the triple spaced contour bay. From 2000 to 2008, and when there was comparable data, the single spaced contour bay produced a 31 per cent reduction in soil yield compared to the triple spaced contour bay (Table 2).
Ground cover was generally maintained above 30 per cent. However, during 2003, 2004 and 2008 wet seasons, cover deteriorated to less than 10 per cent before planting or after crop harvesting.
Runoff from the triple spaced contour bay was generally less than the single spaced contour bay, but the sediment concentration was higher. These findings were largely supported by a review of studies in north-western Australia where double spaced contour banks lost more soil than single spaced contour banks due to the increased velocity of runoff and its ability to scour and transport sediment.
| Year | Single spaced contour bay | Triple spaced contour bay | |||
|---|---|---|---|---|---|
| Rainfall (mm) | Runoff (mm) | Soil loss (t/ha) | Runoff (mm) | Soil loss (t/ha) | |
| 2000 | 572 | 162 | 3.5 | 99 | 4 |
| 2001 | 400 | 2 | 0.1 | 0.4 | 0.05 |
| 2002 | 346 | 0 | 0 | 0 | 0 |
| 2003 | 473 | 26 | 0.7 | 32 | 1.5 |
| 2004 | 412 | 0 | 0 | 5 | 0.15 |
| 2005 | 562 | 24 | 0.6 | 7 | 0.3 |
| 2006 | 510 | 0 | 0 | 1 | 0.05 |
| 2007 | 829 | 343 | 2.8 | 258 | 4.9 |
| 2008 | 431 | 112 | 3.3 | 103 | 4.6 |
| Average | 504 | 74 | 1.2 | 56 | 1.7 |
| Total | 4535 | 672 | 11 | 505 | 16 |
Authors
Rogusz D, Rohde K and Burger P, Queensland Department of Natural Resources and Mines, Emerald, 2016.
Acknowledgements
We would like to thank the co-operating landholders for hosting the on-farm study, maintaining crop management records and providing ongoing support for the project.
- Last reviewed
- 18 June 2025
- Last updated
- 29 December 2017