Report card 2017 and 2018
Interactive report card
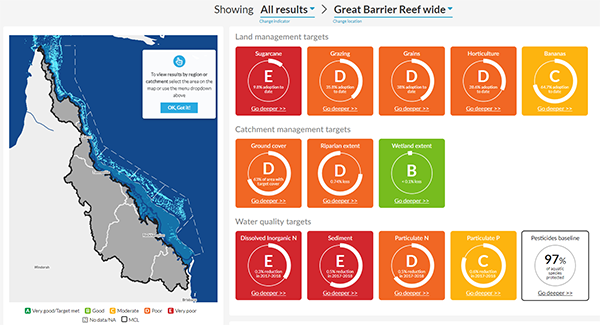
Fully explore the results on our new interactive report card.
Results
The Reef Water Quality Report Card 2017 and 2018 assesses the results of Reef 2050 Water Quality Improvement Plan actions reported up to June 2018.
For the first time, results are reported at a finer catchment and sub-catchment scale.
The report card draws on multiple lines of evidence including industry best management practice and extension programs. Science underpins the report card with all results reviewed by the Independent Science Panel.
Science shows improving the quality of water flowing to the Great Barrier Reef is critical to building its resilience and enabling it to recover from the impacts of climate change, which is the greatest threat to the Reef.
While many landholders have improved their land management practices, the results reflect the scale of change required to meet the water quality targets. The Australian and Queensland governments are investing more than $600 million to deliver actions in the plan through to 2022.
Results are considered a conservative estimate of progress as not all land management activities undertaken during the reporting period are included.
Key messages
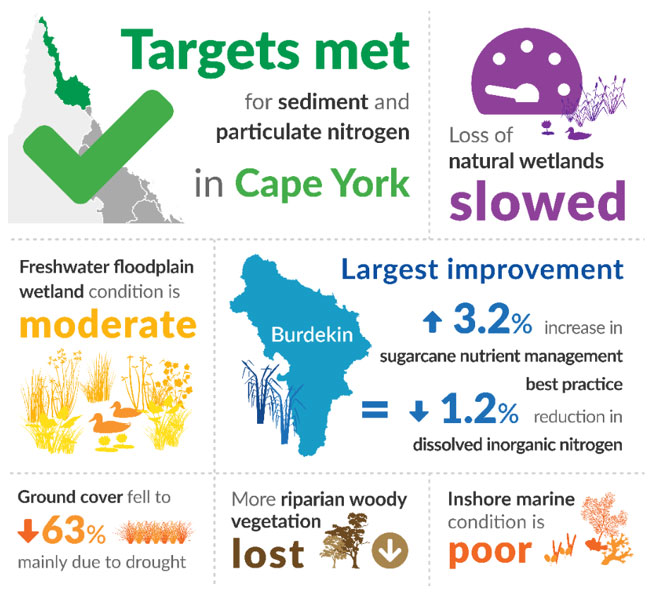
- The Cape York sediment and particulate nutrient targets were met. Modelling shows the average annual loads of sediment reduced by 1.8% to 9.8%, almost double the 5% target. Reductions were due to improved pasture management from destocking cattle and controlling feral animals on the Queensland Government owned Springvale Station, and improved pasture and gully management through the Australian Government Reef Trust gully erosion project.
- The Burdekin region recorded the largest improvement (up 3.2% to 19.6%) in best practice nutrient management for sugarcane. Improved nutrient management was delivered through the Queensland Government Burdekin Nitrogen Project and the Australian Government Reef Trust: Reef Alliance Growing a Great Barrier Reef project.
- Modelling shows the annual average load of dissolved inorganic nitrogen flowing from the Burdekin reduced by 1.2% to 26.7% as a result of these projects.
- The loss of natural wetlands across Great Barrier Reef catchments slowed with less than 0.1% loss (556 hectares) between 2013 and 2017.
- Throughout the catchments, freshwater floodplain wetlands remained in moderate condition.
- Loss of riparian woody vegetation across the Great Barrier Reef catchments increased with 45,467 hectares (0.74%) loss between 2013 and 2017.
- The proportion of grazing land across the Great Barrier Reef catchments with adequate ground cover to reduce erosion was 63%, below the target of 90% due to many areas being drought declared.
- Overall inshore marine condition was poor in 2017-2018, with coral rated moderate and seagrass and water quality in poor condition. The Cape York, Wet Tropics and Burdekin regions were in moderate condition overall and the Mackay Whitsunday, Fitzroy and Burnett Mary regions were in poor condition.
Fully explore the results on our new interactive report card.
Results
- Detailed results
- Management practices
- Ground cover
- Catchment pollutant loads
- Pesticide risk baseline
- Riparian extent
- Wetland extent
- Wetland condition
- Marine monitoring
- Marine modelling
Information about how the key indicators were measured is available in the Methods section .
Read this fact sheet, to learn more about investments that will be captured in future report cards.
For more information, read the frequently asked questions.
Contributors
- Australian Government
- Queensland Government
- Great Barrier Reef Marine Park Authority
- Australian Institute of Marine Science
- The University of Queensland
- Cape York Natural Resource Management Ltd
- Terrain Natural Resource Management
- NQ Dry Tropics
- Reef Catchments
- Fitzroy Basin Association
- Burnett Mary Regional Group
- Canegrowers
- CSIRO
- TropWATER
- Growcom
- Queensland Farmers’ Federation
- NRM Regions Queensland
- AgForce
- Australian Banana Growers’ Council
- Bureau of Meteorology
- Last reviewed
- 5 June 2023
- Last updated
- 30 August 2019

