FAQs
Why is the focus on agriculture?
Everyone, not just farmers, needs to play their part in improving water quality. While it is important that all industries minimise run-off to the Reef, the largest contribution to nutrient, sediment and pesticide run-off is from broad-scale agriculture.
Urban and other land uses, including industrial, contribute approximately 2% to the fine sediments discharged to the Reef. Urban areas contribute approximately 7% of the anthropogenic dissolved inorganic nitrogen load, and may be important at local scales.

The Reef 2050 Water Quality Improvement Plan addresses all land-based sources of water pollution including run-off from urban, industrial and public lands. It also recognises the importance of people in creating change.
Partnerships across all sectors at all levels continue to be key to making progress towards the water quality targets. This includes governments working together with agriculture, industry, urban development and construction, conservation, community and natural resource management stakeholders to improve the quality of water flowing from the catchment to the Reef.
An urban stewardship framework has been developed to assess and report on the level of urban water stewardship in Reef catchments to demonstrate the degree to which urban water managers are contributing to improving water quality. It is expected that this new reporting will be incorporated into the Reef Water Quality and regional report cards in future years.
How is marine water quality assessed?
Given the size of the Great Barrier Reef and the dynamic and changing nature of conditions the Reef experiences (such as weather, water movement and river discharges), it is impossible to rely solely on in-water monitoring data to confidently assess marine water quality over entire zones or regions.
Using remote sensing (satellite imagery) helps to overcome this problem. However, issues arise when cloud cover prevents assessment of the marine waters and turbidity hinders independent measures of sediment and nutrients. This happens frequently during the wet season when most of the discharge from rivers occurs.
Marine water quality scores are assessed using the eReefs model which integrates multiple lines of evidence including satellite imagery and is validated against marine monitoring data in specific locations. The eReefs model accounts for weather conditions, water movement, freshwater river discharges and pollutant loads to provide daily estimates of water quality across the Great Barrier Reef and through the water column. This provides an annual snapshot of marine water quality for the reporting year that contributes to the marine condition scores. As this is an annual assessment and is influenced by variations in rainfall, drier years will typically report improved water quality.
Why is inshore coral condition still poor?
Inshore corals remained in an overall ‘poor’ condition, primarily due to storms and above-average sea temperatures in the summer of 2020. Some signs of recovery were observed, with both coral cover and juvenile density increasing at some locations.
Since 2016, cumulative pressures have contributed to coral decline across the inshore Reef (trends vary within regions). This is because the Reef is under pressure from multiple threats that are cumulative and increasing. Poor coral condition reflects the complex interaction between ecological processes and a range of pressures, which include thermal anomalies, above-average rainfall leading to river discharge into the Reef lagoon, pollutant run-off and exacerbating the severity of outbreaks of coral-eating crown-of-thorns starfish. Above-average seawater temperatures in early 2020 caused coral bleaching in some inshore reefs, mainly in the Burdekin, Mackay-Whitsundays and Fitzroy regions. Populations of crown-of-thorns starfish were increasing in numbers on reefs in the Johnstone Russell-Mulgrave sub-region, where multiple cohorts of starfish were observed at densities sufficient to categorise reefs as harbouring active outbreaks. The cover of macroalgae, which compete with corals, also continue to increase in some areas.
Refer to the Marine Monitoring Program publications for more information on the condition and trend of inshore corals.
Why is seagrass condition still poor?
Inshore seagrass meadow condition remained unchanged from the previous year and in a ‘poor’ state for the eighth year in a row. However, trends were not uniform across the Reef, with some improvement in the Burdekin and Mackay-Whitsunday regions. Inshore seagrass condition remains poor due to a history of cumulative pressures facing inshore meadows in recent years, such as cyclones, floods, thermal anomalies and periods of very low light availability. Recent regionally significant impacts were caused by cyclone Debbie in 2017 affecting the Mackay–Whitsunday region, and floods in the Burdekin region in 2018–19. Legacy effects of these past pressures are evident in current seagrass condition and highlight the ongoing need for recovery of this important habitat.
The cumulative pressures resulted in poor condition of seagrasses in the past three reporting years, including in the 2019–20 reporting period. This condition was driven mostly by seagrass loss in the Burdekin region, with smaller declines also occurring on average in Cape York and the Wet Tropics. There is a legacy effect of heavy rainfall and above-average discharge from rivers in these regions in early 2019. However, there were increasing or stable abundance of seagrasses at more than half of inshore Reef sites with greatest improvements in the Mackay–Whitsunday region, which was relatively free from disturbances in recent years.
Refer to the Marine Monitoring Program publications for more information on the condition and trend of seagrass and seagrass meadows.
Why do we use catchment modelling, not just monitoring?
Monitoring shows pollutant loads leaving catchments vary significantly from year to year, mainly due to differences in annual rainfall and run-off. Therefore, modelling is used to estimate the long-term annual pollutant load reductions due to the adoption of improved land management practices. This removes the impact of factors such as climate variability and allows us to determine the expected benefits of improved land management now rather than monitoring for decades to see a trend.
Research suggests that time lags to see improvements from land management practice change in monitoring data could range from years (for pesticides) up to decades (for nutrients and sediments). This is due to factors such as the high degree of variability in rainfall year to year. The catchment models use measured changes in land management and well-documented and accepted methods and assumptions. Long-term water quality monitoring data is used to validate and improve the models, continuously improving confidence in the estimates of water quality over time.
How is progress towards the load reductions targets assessed?
Catchment modelling estimates average annual loads of key pollutants for each of the 35 catchments draining to the Great Barrier Reef. The modelling reports on reductions from the anthropogenic baseline load each reporting period based on the adoption of improved land management practices.
Catchment load reduction targets for 2025 are set for the whole of the Great Barrier Reef, the six regions and 35 catchments. Progress towards the targets is reported as the reduction since the last report card, as well as the overall cumulative reduction to date.
Scores are based on the minimum reductions required to achieve the 2025 target (the required reduction divided by the number of years remaining). The scoring assesses each year against the minimum annual progress required to achieve the target. As a result, grades may change year to year, based on how they are tracking towards targets. This may mean results are rated poorly if the required amount of progress is not achieved that year. Overall cumulative progress to targets is represented in the report card to provide context, but is not scored.

What industry Best Management Practice (BMP) data is used in the report card?
Practice change programs and projects report data at a farm level, de-identified to protect grower privacy, which is then used in modelling.
Smartcane BMP is the sugar cane industry’s voluntary BMP program for sugarcane growers and is managed and lead by Queensland Cane Growers Organisation Ltd (CANEGROWERS). In 2020, Smartcane BMP contributed 25,188 ha of de-identified data to the Reef water quality report card (20% of accredited land in Smartcane BMP at the time). CANEGROWERS has been working with Smartcane BMP accredited businesses since 2019 to contribute anonymous data to the Reef water quality report card, to indicate industry best practice adoption and progress toward the Reef 2050 land management and water quality targets.
Industry BMP data was used to help develop the farm management practice adoption benchmarks which estimate the existing extent of adoption of key practices.
What is the impact of drought on ground cover reporting?
Ground cover reporting is an objective measure of the level of cover in the dry season derived from analysis of satellite imagery.
Across regions and catchments, ground cover varies due to localised rainfall, land management and landscape type.
Climatic cycles of droughts and rains associated with El Niño and La Niña, and other longer-term climate phenomena, can have a pronounced effect on the level of ground cover. During drought conditions, annual ground cover levels will vary from long-term averages, with the recent drought resulting in low ground cover levels across the Great Barrier Reef catchments.
For areas in extended drought, ground cover levels are likely to decline, however there may be a lag effect associated with this depending on the natural resilience of the landscape and other effects such as de-stocking in sustained drought periods. Similarly, it may take time for ground cover levels to increase and become stable after the onset of above-average rainfall. Recovery can also be further delayed if the land is already degraded due to poor land management.
Annual rainfall data for the 12 months preceding the reported season is included with ground cover reporting, to show where there has been above or below average rainfall. Late dry season rainfall during the reported season may have short-term impacts on local ground cover levels, which may be reflected in the regional results. In general, while some management actions can have some influence on improved localised ground cover levels in a relatively short timeframe, seeing measured improvements due to management is dependent on how higher cover levels are sustained over time, with continued implementation of good ground cover management practices on a regional scale.
Maintaining ground cover during drier periods is important to protect the landscape from degradation when rain does eventually come. High intensity rainfall when droughts break can often present the greatest risk of soil erosion and increased sediment entering waterways.
How is riparian extent measured and why are the results unchanged?
Changes in riparian vegetation extent are assessed every four years. Results were last updated in Report Card 2017 and 2018 for the reporting period 2013 to 2017 and are due to be updated again in the next Report Card.
The riparian area is defined as any area within 50 metres of a (mapped) stream or riverine wetland which is compatible with ‘Category R’ riparian vegetation, defined in Queensland’s vegetation management framework. The riparian vegetation reporting is separated into two components, riparian forest and riparian ground cover. Data derived from satellite imagery is used to estimate the amount of riparian forest cover and ground cover. Clearing of riparian forest is then measured using data from the Statewide Landcover and Trees Study for the period of reporting.
Vegetation management laws passed by the Queensland Government in 2018 regulate clearing to conserve remnant vegetation, minimise land degradation, maintain ecological processes and prevent the loss of biodiversity. This includes the regulation of clearing vegetation within 50 metres of an identified regrowth watercourse in all Great Barrier Reef catchments. For further information refer to the Vegetation management.
What does pesticide risk measure?
Pesticide risk is the estimated average per cent of aquatic species that are protected from the direct impacts of the mixtures of pesticides in a waterway and, therefore, should not experience adverse effects from pesticides. Generally, as pesticide concentrations increase, the percentage of species protected will decrease and the effects on organisms will worsen. For example, if the pesticide risk is 95%, this means 95% of aquatic species in an ecosystem should be protected. It also means 5% are expected to experience some adverse effects such as reduced growth, reproduction or population. For the pesticide target (99%) to be met, pesticide concentrations need to be reduced to ensure an additional 4% of species are protected.
Pesticide risk is based on an estimate of the percentage of species that should be protected from the harmful effects of up to 22 pesticides commonly detected in catchments during the wet season, but only at those locations where water is sampled. For more detail see the Report card methods.
How do we measure and report pesticide risk?
The 2020 pesticide condition results are calculated using monitoring data. Results from the end-of-catchment monitoring are scaled up to represent the risk at the whole-of-catchment, regional and Great Barrier Reef scales. Pesticide risk can vary as you move up the catchment, particularly as you get closer to the source of pesticides. Pesticide monitoring results are reported through an interactive story map. Refer to Modelling and monitoring program page.
As the 2020 pesticide condition is based on monitoring data, it is important not to view changes from a single year of results as a trend that could be explained by changes in land management. Trends will only be perceptible if the change is observed over several years.
Why is pesticide risk for the entire catchment sometimes different to the risk reported at the monitoring site?
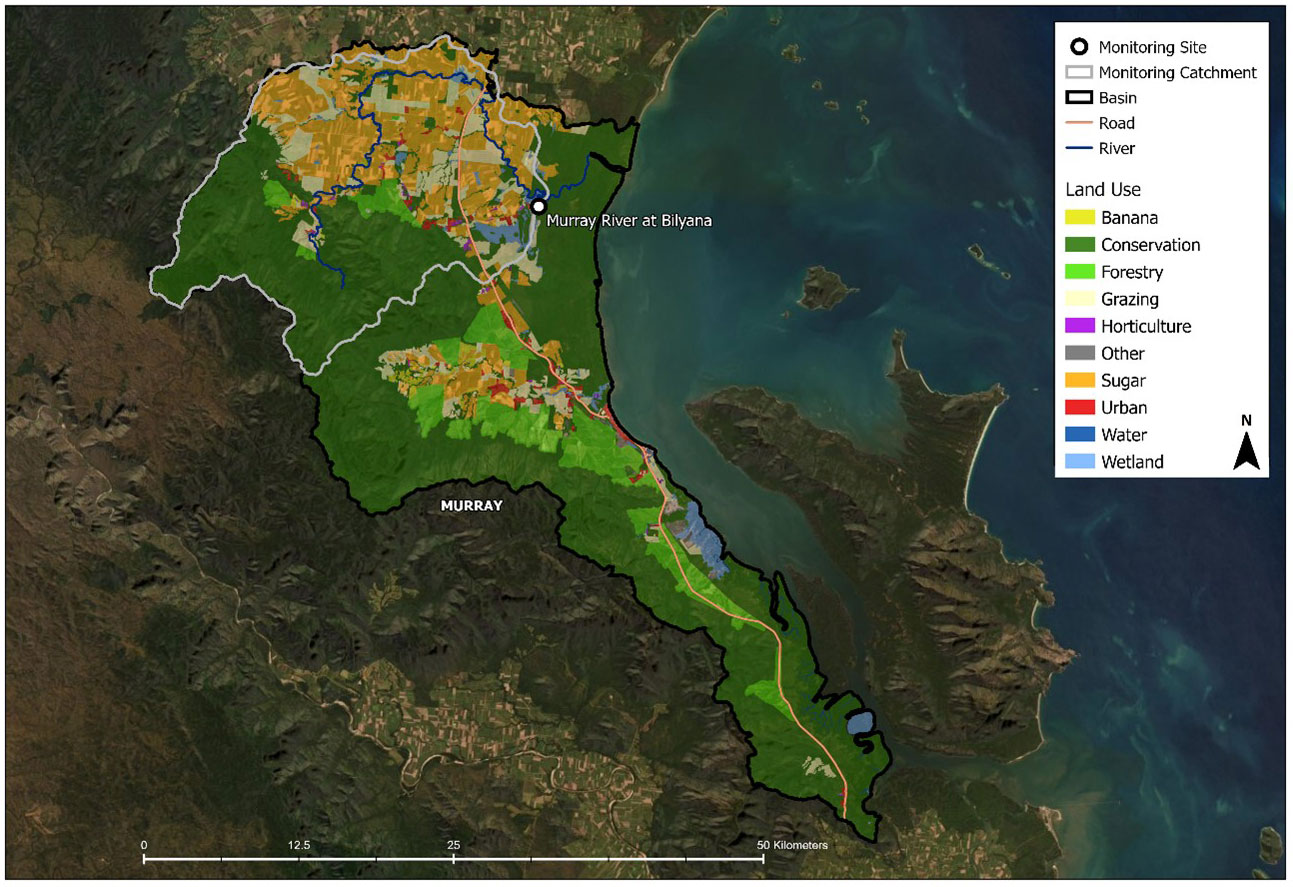
The Pesticide Risk values reported in the Reef Water Quality Report Card and Great Barrier Reef Catchment Loads Monitoring Program (GBRCLMP) Condition Report are both calculated from catchment monitoring data, but sometimes a different value is reported for the same catchment. This is because the Pesticide Risk value reported in the GBRCLMP Condition Report represents the runoff from the land area (and its land use) upstream of the monitoring site located within the catchment. Whereas the Pesticide Risk value reported in the Report Card represents the land area (and its land use) of the whole catchment, which is larger than that upstream of the monitoring site. For example, the figure below shows the land area upstream of the Murray River monitoring site (inside the Monitoring Catchment grey line), which is smaller than the total Murray catchment area (inside black line).
Has the risk from insecticides gone from the Tully catchment?
Insecticides appear to be contributing less than 1% risk within the Tully Catchment, down from a 18% contribution reported in the previous 2019 Reef Water Quality Report Card. Tully River monitoring data in 2019-2020 indicated there were still some detections of the insecticide imidacloprid present in runoff; however the substantial reduction in imidacloprid concentrations also means a substantial reduction to their risk to the environment.
How is wetland extent measured and why are results unchanged?
Changes in wetland extent are reported every four years based on updated mapping. Results were updated in Report Card 2017 and 2018 to include the 2013-2017 reporting period and are due to be updated again in the next report card.
The results detail the loss of natural and modified wetlands for all four-year reporting periods as a percentage of change in the wetland extent in relation to the start of the reporting period.
What are the standout results from land management projects?
Sugarcane
Key programs contributing to improved water quality from sugarcane lands include the Queensland Government’s Smartcane BMP program which reported 25,188 hectares of management practice improvements; the Australian Government’s Reef Trust Partnership Reef Alliance Project Phase 2 which reported 24,840 hectares of sugarcane management practice improvements; the Australian Government’s Reef Trust: Project Uplift project which reported 12,622 hectares of sugarcane management practice improvements; and the Australian Government’s Reef Trust Reverse Tender program which reported 12,964 hectares of sugarcane land that reduced nitrogen applications rates.
Grains
The main program that contributed to improved water quality from grains lands was the Queensland Government’s Grains Extension program which reported 7,792 hectares of improved farm management across the Fitzroy and Burnett Mary regions.
Grazing
Key programs that contributed to reductions in sediment from grazing lands include the Australian Government’s Reef Trust: Reef Alliance: Growing a Great Barrier Reef project which reported 1,163,977 hectares engaged in improved grazing and gully management; the Australian Government’s Reef Trust: Project Pioneer which reported 483,819 hectares engaged in improved grazing and gully management; the Australian Government’s Reef Trust Partnership Reef Alliance Project Phase 2 which reported 293,804 hectares engaged in improved grazing and gully management; and the Queensland Government’s Grassroots project which reported 158,161 hectares engaged in improved grazing and gully management.
Bananas
The key program that contributing to improved water quality from bananas was the Queensland Government’s Banana BMP partnership which reported 148 hectares of improved management.
What is social monitoring?
Social monitoring through practice change projects funded by Australian and Queensland governments started in mid-2019. Data collection and reporting will continue to improve over time.
Social monitoring provides insights into why (or why not) farmers are making land management decisions. This data also informs the design of Reef investment programs. In addition, the information is part of reporting on the progress towards the Reef 2050 WQIP Human Dimensions target: Active engagement of communities and land managers in programs to improve water quality outcomes is increased.
Participating farmers can choose to answer social monitoring questions both at the start of their practice change journey (‘before’) and at the end of their practice change journey (‘after’). The Reef Water Quality Report Card 2020 includes data from 2019-20 where more than 50 individual social monitoring records per region and commodity were reported ‘before’ and ‘after’ practice change. The quantity of grazing and sugarcane data varies across Reef regions. In some areas, it is below 50 records (i.e. below the threshold). Therefore, data were aggregated by the sugarcane and grazing industries for the Great Barrier Reef wide region and not presented on a catchment-by-catchment basis. Whilst data were collected for the banana industry, there was insufficient data to be reported for this period, but this should be included in future report cards.
The Report Card 2020 outlines two infographics (grazing and sugarcane) showcasing motivations (before engagement in the project), barriers, attitudes and their confidence in new practices (after engagement in the project).
Learn more about the social monitoring results.
- Last reviewed
- 18 June 2025
- Last updated
- 8 April 2022