Nitrogen rate impacts sugar levels, runoff and leaching from plant cane in the Wet Tropics region
About this case study
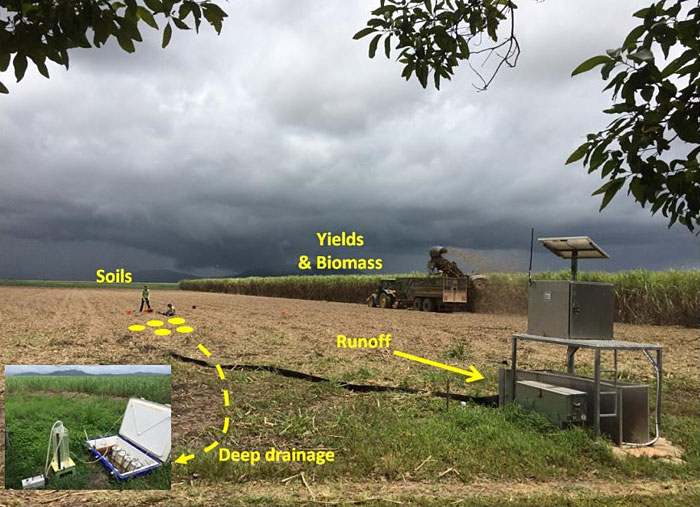
This project trialled a range of nitrogen (N) application rates and a controlled-release N fertiliser (i.e. slow release) on plant cane to understand the impact on surface water runoff, drainage and yield (Figures 1 and 2).
 Open larger image
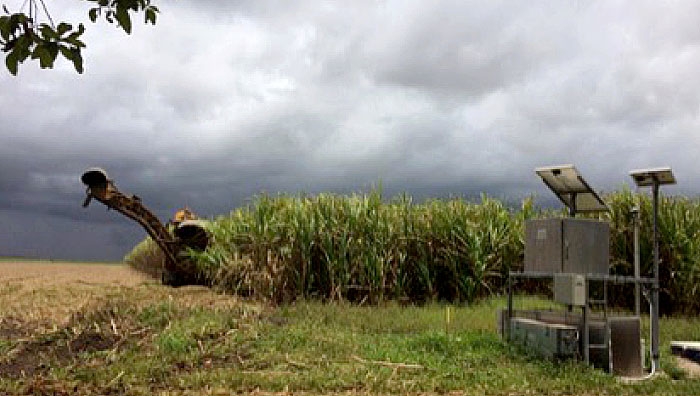
Figure 1: A runoff plot at the Silkwood sugarcane study site. Surface water runoff, deep drainage, soil, biomass, and yield are monitored.
 Open larger image
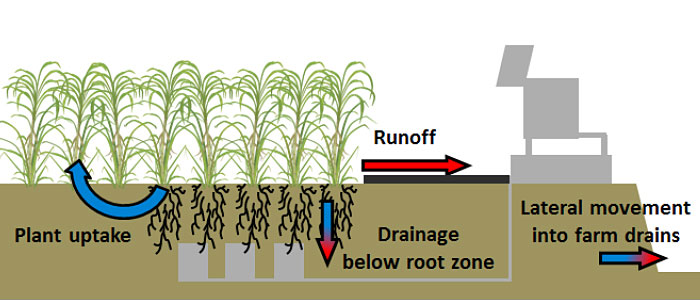
Figure 2: Schematic diagram of nitrogen pathways measured at the Silkwood sugarcane study site.
Key findings
- In high rainfall environments such as the Wet Tropics in far north Queensland, nitrogen (N) loss from plant cane via surface water runoff as well as drainage under the crop’s root zone (leaching) and laterally into bordering drains can be substantial - even if rainfall is experienced several months after fertiliser application.
- The under-developed root system characteristic of plant cane does not have the same capacity as ratoon cane to readily take up available N. Therefore, the plant phase has been identified as a high risk period for N loss.
- This study demonstrated that targeting N rates to plant crop requirements lowered N losses, whilst still maintaining good commercial cane sugar (CCS) levels.
- The controlled-release N product trialled had the lowest N losses. However, this improvement was only marginal compared to urea applied at the same rate. These products are expected to provide lower N losses in wetter years than experienced in this study.
Implications for management
These results highlight the importance of using recommended N rates to reduce runoff and leaching losses, whilst maintaining good sugar levels. Controlled-release N fertilisers may provide further benefits but more research is required.
Methods
Four water quality monitoring stations were established on a sugarcane paddock in Silkwood, 25 kilometres south of Innisfail. Each station collected surface water runoff and deep drainage (one metre depth) from plots of cane receiving different rates of nitrogen (see Table 1 and Figure 3). Rainfall, runoff, drainage and yields were closely monitored during the 2014 to 2015 wet season (plant phase). Runoff and drainage water samples were analysed for total N and dissolved inorganic N (DIN = ammonium + nitrate).
The monitoring site was established with GPS guidance on two metre wide beds with dual cane rows (variety Q183). The paddock is situated on a gently eastern sloping (less than one per cent) alluvium floodplain deposit within the South Johnstone drainage basin.
The soil was described as a Bulgan series and a Hydrosol (poorly draining) in the Australian Soil Classification. The total carbon content in the soil surface was more than five per cent.
The paddock was bordered on three sides by large drains more than one metre deep to facilitate drainage and prevent the paddock from waterlogging. This is typical of sugarcane grown in low lying areas throughout the Wet Tropics.
The site was not irrigated.
| Treatment 1 | Treatment 2 | Treatment 3 | Treatment 4 | Treatment 5A | |
|---|---|---|---|---|---|
| Rate (kg N/ha) | 194 | 134 | 94 | 94 | 67 |
| High rate | Close to 6ES rate without mineralisation index (140) | Close to 6ES rate with full minerlisation index (80) | Close to 6ES rate with full minerlisation index (80) | Low rate | |
|
Product (at top-dress) | Granular urea | Granular urea | Granular urea | Controlled-releaseB | Granular urea |
Method: 2 applications: 34 kg N/ha across all treatments (as DAP & liquid N) at planting on 21 July, followed up with remaining N on 2 October, 2014 (i.e. top dress). Fertiliser was surface applied then lightly cultivated underneath the soil surface.
Notes: 6ES = Six Easy Steps. ANo water quality monitoring for Treatment 5 (yields only); BControlled-release = polymer coated N.
 Open larger image
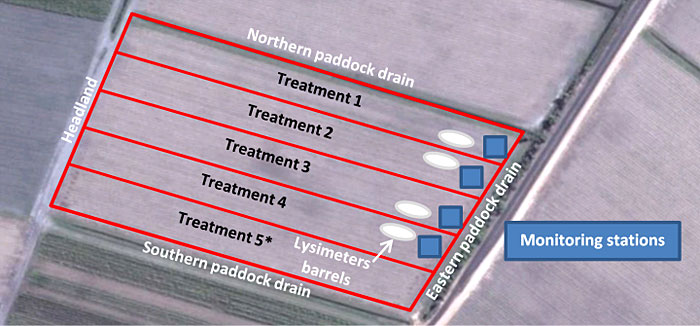
Figure 3: Sugarcane monitoring site with five nitrogen treatment plots in Silkwood Treatments 1-4 were monitored with water quality and yields. Treatment 5 was only monitored for yields. Lysimeter barrels collected deep drainage at 1m depth.
Results
Runoff
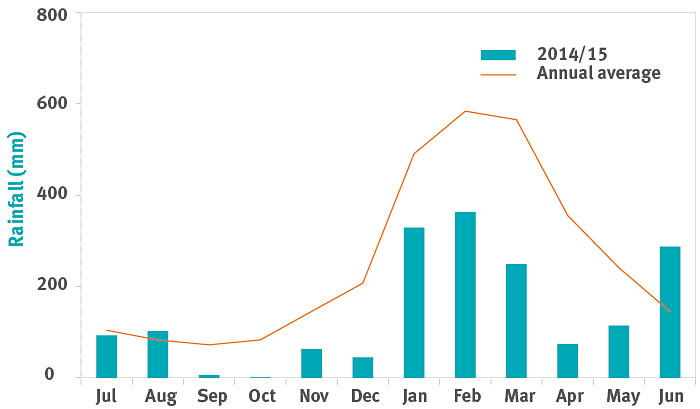
Rainfall during the 2014 to 2015 season (1,726 mm) was below the long-term average of 3,100 mm/year (Figure 4). However, several runoff events were monitored during this period.
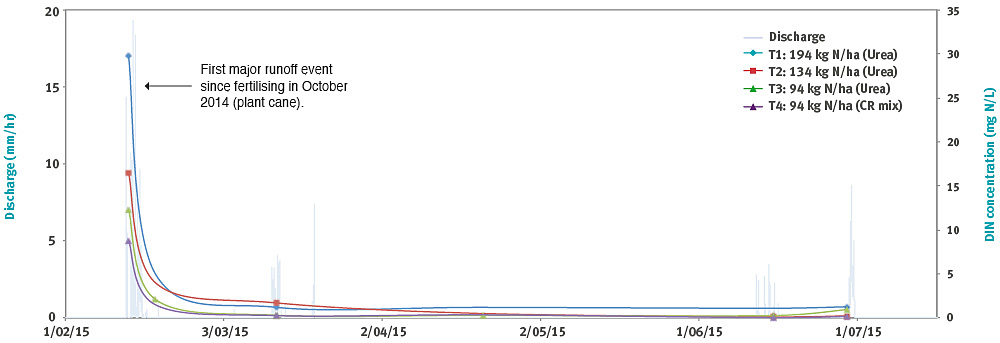
Overall, the highest DIN concentrations of the season were measured in the first runoff event, with clear differences between treatments (Figure 5). Treatment 1 (30 mg/L) had the highest DIN concentration and was the treatment which received the greatest N application. The lowest DIN concentration was from Treatment 4 (9 mg/L), which was top dressed with the controlled-release N product, close to the recommended Six Easy Steps rate.
Throughout the rest of the wet season DIN concentrations quickly declined in subsequent runoff events. A few winter runoff events occurred during this season. In these events Treatment 1 still had the highest DIN concentrations of all treatments. However, overall concentrations were below 2 mg/L (Figure 5).
Deep drainage
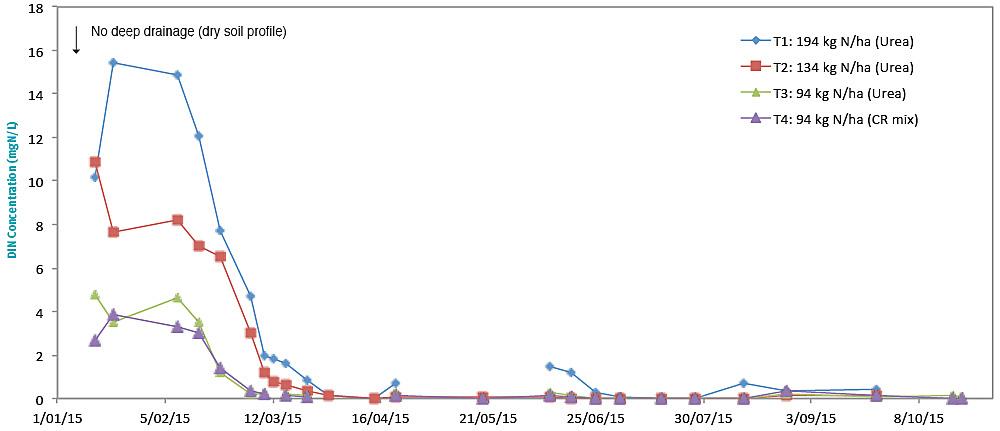
Samples collected from below the root zone indicated clear differences in DIN losses from each treatment (Figure 6). These treatment differences are evident throughout January and February with average DIN concentrations of 12, 8, 4 and 3 mg/L for Treatments 1 to 4, respectively. By March concentrations had declined rapidly over time and remained less than 1.5 mg/L for all treatments for the remainder of the season.
Water seeping through the soil into the paddock drain had DIN concentrations up to 11 mg/L from the end of the paddock with the higher N treatments, and up to 6 mg/L near the lower treatments. This highlights lateral movement into these drains as a significant loss pathway for DIN.
Yield
Harvest of the plant crop took place on 11 November 2015 (Table 2 and Figure 7). In general, the yields for each treatment are considered above average for this paddock compared with accessible crop records. The highest tonnage of cane was from Treatment 1. However, this cane also had the lowest CCS level, and suffered from lodging and suckering. This was a result of the late harvest schedule and high N rate. Some minor lodging was also evident in Treatment 2.
| Treatment 1 | Treatment 2 | Treatment 3 | Treatment 4 | Treatment 5 | |
|---|---|---|---|---|---|
| Plant rate (kg N/ha) | 194 | 134 | 94 | 94 | 67 |
| Product | Urea | Urea | Urea | CR mix | Urea |
| TCPH | 113 | 101 | 88 | 85 | 84 |
| CCS | 12.2 | 14.1 | 14.6 | 14.4 | 13.8 |
| TSPH | 13.8 | 14.2 | 12.9 | 12.2 | 11.6 |
Note: TCPH = Tonnes of cane per hectare. CCS = Commercial Cane Sugar.
TCPH x CCS/100 = TSPH (Tonnes of sugar per hectare).
 Open larger image
Figure 4: Monthly rainfall totals at Silkwood monitoring site vs. the long term average.
 Open larger image
Figure 5: Dissolved inorganic nitrogen concentrations in surface water runoff.
 Open larger image
Figure 6: Dissolved inorganic nitrogen concentrations in deep drainage under plant cane.
 Open larger image
Figure 7: Harvesting the plant crop in November 2015.
 Open larger image
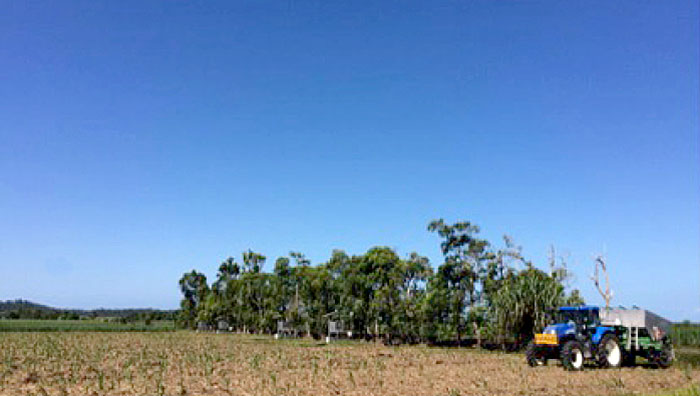
Figure 8: Applying fertiliser treatments to the first ratoon after the plant cane harvest in November 2015. Monitoring will continue throughout the ratoons.
Acknowledgements
We thank MSF Sugar for supporting this trial through access to their property, crop management records and continued assistance throughout the project.
Authors
Masters1, C. Mortimore1, N. Tahir1 and D. Sparkes2. 1Queensland Department of Natural Resources and Mines, Mareeba; 2Queensland Department of Agriculture and Fisheries, Cairns
- Last reviewed
- 23 June 2023
- Last updated
- 29 December 2017